Social performance is no longer a soft metric. Denominator's latest research on financial materiality finds a consistent and measurable link between how companies treat their people and how they perform financially.
What the data reveals:
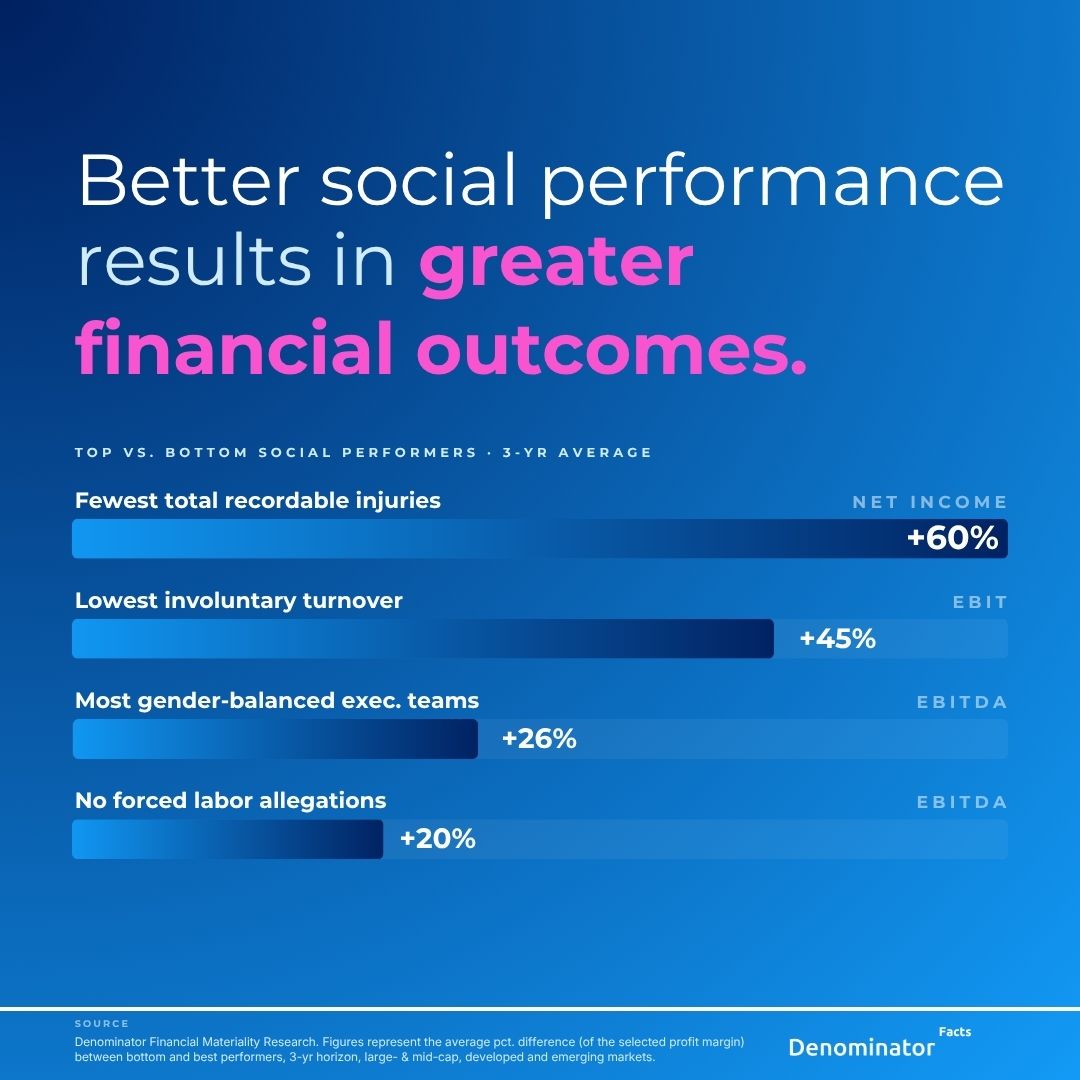
Analyzing large and mid-cap companies across developed and emerging markets over three years, Denominator compared the financial performance of top and bottom social performers across over 150 data points. Here are four key findings for profit margins:
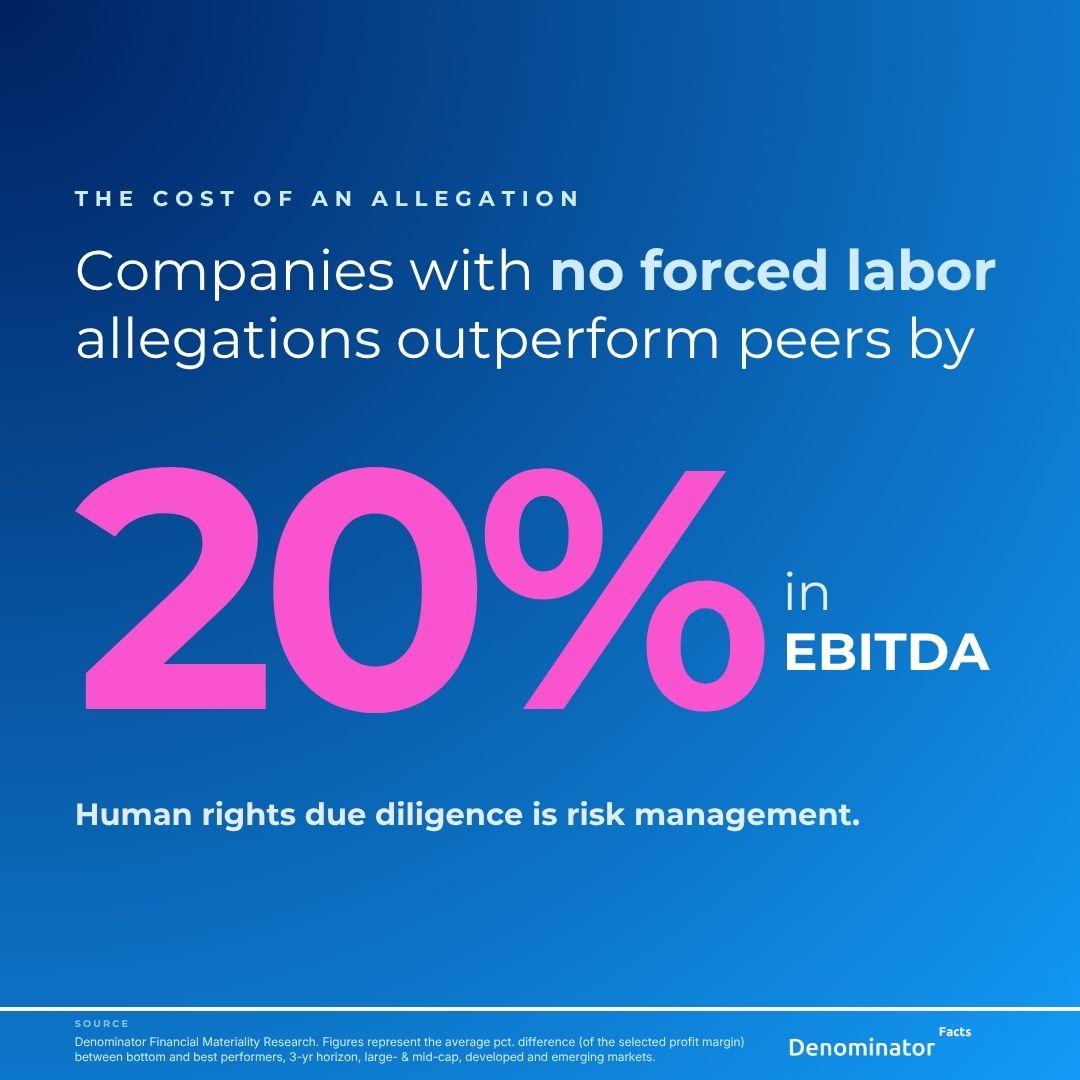
+20% EBITDA: Companies with no record of forced labor allegations outperform peers in EBITDA by 20%.
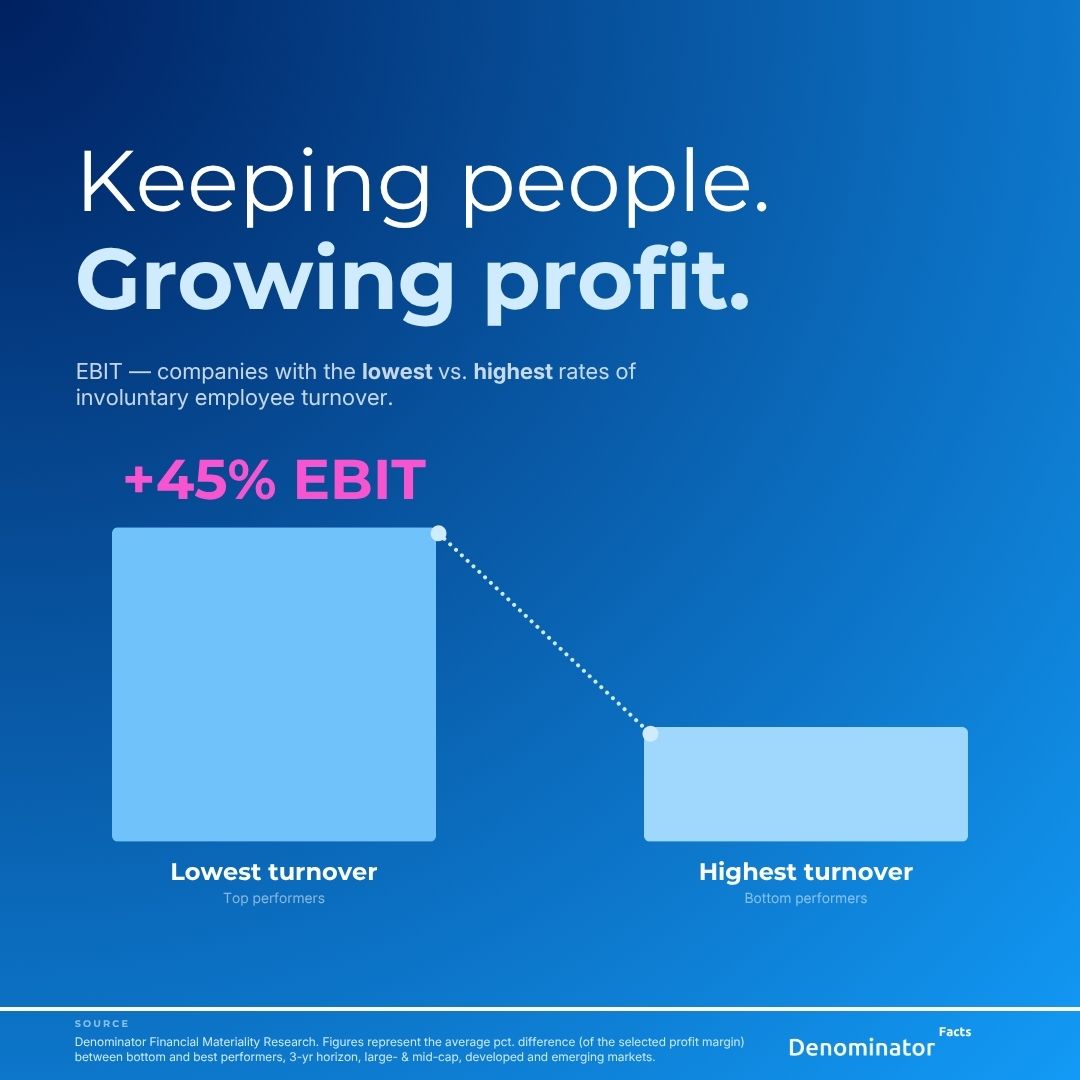
+45% EBIT: Companies with the lowest rate of involuntary employee turnover show 45% higher EBIT.
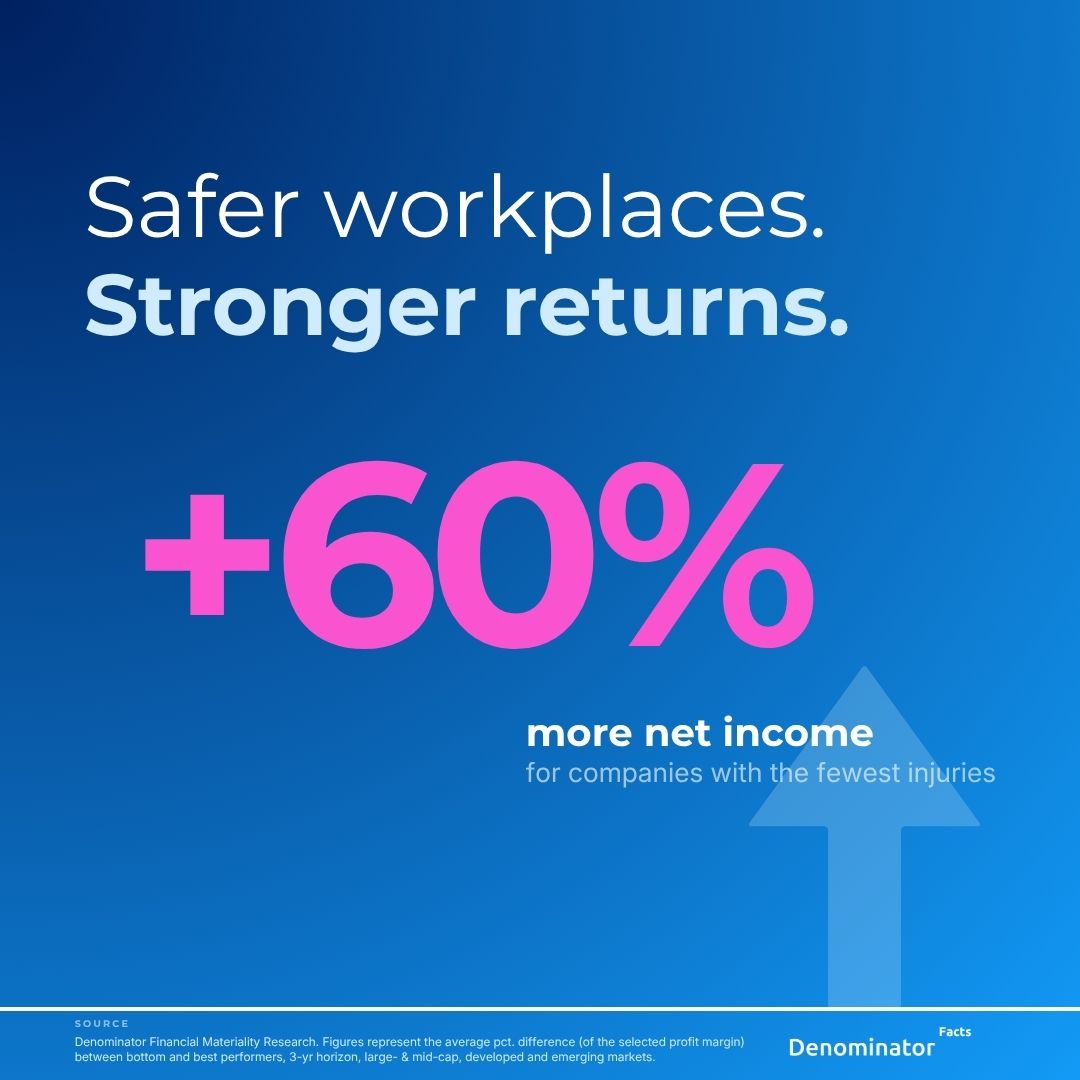
+60% Net Income: Firms with the lowest number of total recordable injuries achieve 60% more net income.
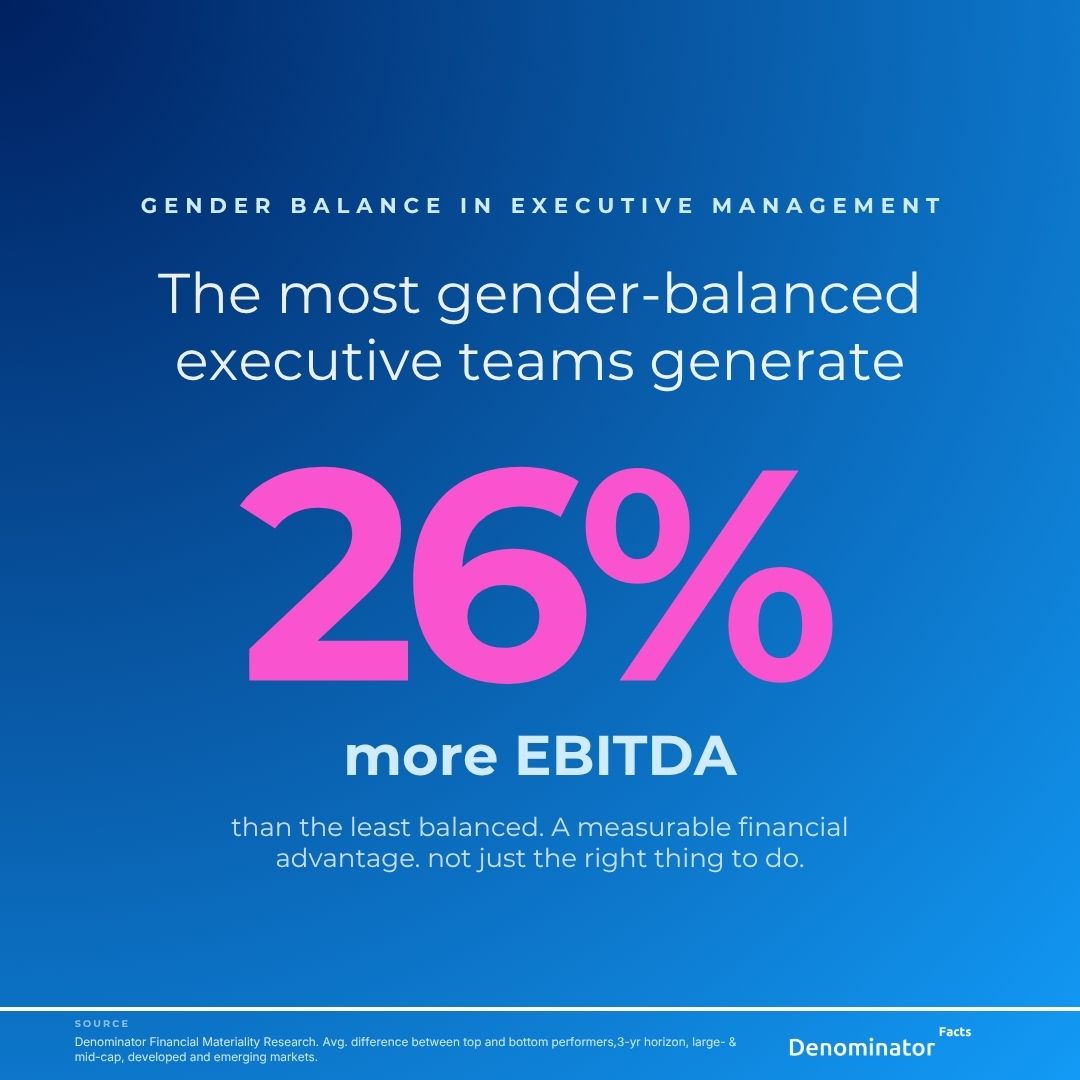
+26% EBITDA: Companies with the most gender balance in executive management outperform on EBITDA by 26%.
Taken together, these findings point in one clear direction: the companies doing better on social factors (protecting workers, retaining talent, maintaining safe workplaces, and building diverse leadership) are also the companies generating stronger financial returns. The relationship holds across metrics and across markets.
From data point to investment signal
The data points driving these findings (forced labor allegations, involuntary turnover rates, recordable injury rates, and executive gender balance) are all measured within Denominator's Social Model, a framework that quantifies the social footprint of companies globally across four pillars: Human Rights, Labor Practices, Health & Safety, and Diversity. With 175+ data points and 70 scores, it covers approximately 99% of the global equity investment opportunity set, standardising data across company disclosures, websites, and registries.
Social factors have long been seen as qualitative and hard to compare. The Social Model changes that, making human capital data as rigorous and actionable as financial data.
Want to see how social performance translates to financial outcomes in your portfolio?
Explore Denominator's financial materiality research and the Social Model: denominator.com/knowledge-hub
Note: Numbers represent the average percentage difference (of the selected profit margin) between bottom and best performers across 3 years. Results are based on the average performance of large and mid-cap companies in developed and emerging markets (not normalized to sector or country).